- News
- How satellite data empower sus...
How satellite data empower sustainable urban growth
25 May 2023
Earth observation is a vital tool for facilitating the sustainable development of the world's cities, helping to ensure that urban centres keep spurring collaboration, innovation and opportunity as they continue to expand.
Some 56% of the world's population currently reside in cities and the number of urban inhabitants is expected to double by 2050.
This expansion brings with it a number of environmental and social challenges that are being investigated as part of research enabled by ESA's Earth observation activities.
Detecting long-term urban change
ESA's Earth observation archives span several decades and include data from Heritage Missions, such as ERS – which was composed of two satellites named ERS-1 and ERS-2 – and the Envisat mission.
The ERS programme was operational between 1991 and 2011, with Envisat delivering a decade of data following its launch in 2002. Data from these missions are preserved, made accessible on an open and free basis for all users, and continuously improved through ESA's Heritage Space programme.
Heritage missions delivered a wealth of information on cities and, as part of a recent research project, scientists used data from ERS and other remote sensing missions to investigate urban sprawl.
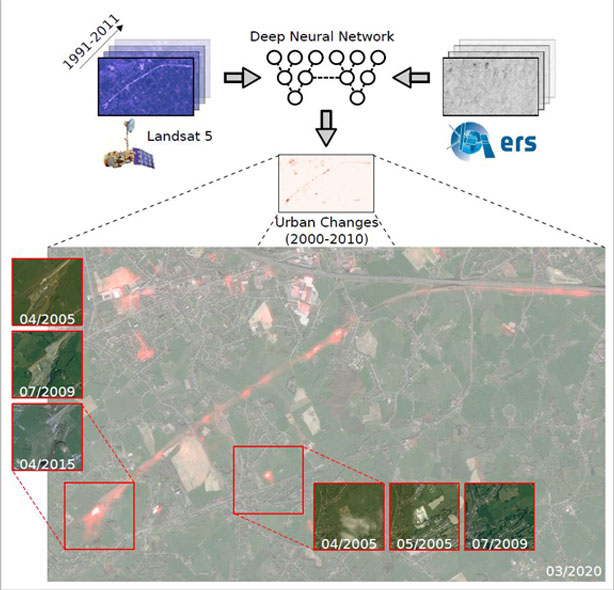
During the project, Earth observation data spanning decades were used to successfully train neural network models to detect long-term changes in cities.
One model – spanning 1991-2011 – was trained on synthetic aperture radar (SAR) data from ERS and optical observations from the Landsat-5 Thematic Mapper (TM), which is archived at ESA and maintained as part of the Heritage Space programme.
Scientists used the ERS Level-1 SAR precision image product in the analysis and ESA's SNAP data processing tool enabled them to properly align these data with the optical measurements.
A second model covering 2017 to the present day was developed using observations from the Copernicus Sentinel missions.
Each model focused on three cities: Limassol in Cyprus, Rotterdam in the Netherlands, and Liège in Belgium. Limassol and Rotterdam were used for training and Liège for evaluation purposes.
The models have a huge number of applications, from monitoring urban sprawl trends and tracking the environmental impact of rapid urban construction, to simply identifying new settlements.
In one analysis, for instance, the neural network trained on ERS data was able to identify areas of Liège temporarily impacted by the construction of a train line.
In the future, the researchers hope to make the model customisable, so users can select and explore different aspects of urban change.
Commercial data supports city planning
Through its Third Party Missions (TPM) programme, ESA disseminates data from external missions on a free basis, for research and application development purposes.
Several TPMs deliver very high resolution (VHR) data that offer a unique view of urban settlements. These data are a vital tool to support planning decisions that mitigate challenges like urban sprawl.
The Pléiades Neo constellation, for instance, consists of two identical satellites phased at 180° from one another that provide imagery with resolutions of 30 cm for panchromatic imagery and 1.2 m for multispectral bands, with a swath width of 14 km.
Imagery of urban settings is delivered by many other TPMs, including the ICEYE constellation, Vision-1, and the SPOT-6 mission.
These data have many applications in urban development, in a recent project, scientists used observations from SPOT-6 and SPOT-7 to create a planetwide dataset that covers every type of location, urban density, and land use.
The product – called WorldStrat – is the most extensive and detailed of its kind.
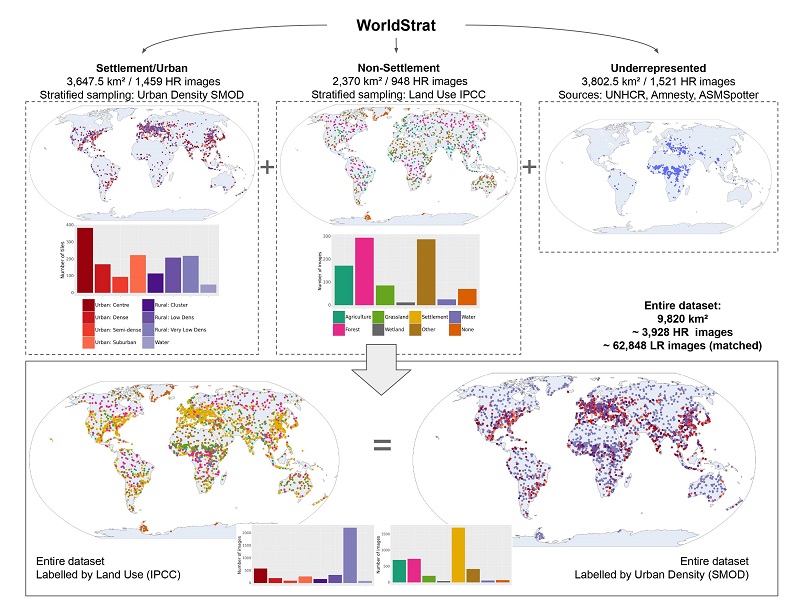
To develop it, scientists used some 4000 high-resolution SPOT images, covering approximately 10,000 square km of Earth's surface.
To improve the temporal resolution of the product, each SPOT image was paired with 16 Copernicus Sentinel-2 images, which were captured at regular intervals of about five days. Around 64,000 Sentinel images were used in total.
With good coverage of multiple types of cities, the WorldStrat dataset – which is available for download – is another example of how satellite data can support urban planning and sustainable infrastructure development.